All posts by Editor

Monitoring vehicle performance

Normally when we track vehicle performance we think in terms of miles per gallon or kilometres per litre. So in figure 1 for example we are looking at the weekly km/litre figure for a 32-tonne flatbed lorry delivering building materials:

Figure 1: trend in kilometres per litre

It is just about possible to discern worsening performance towards the end of the trace. But by taking a slightly different approach we can not only confirm that there is an issue, but also learn more about its timing, nature and magnitude. We should start by plotting weekly fuel consumption against weekly distance traveled as in Figure 2. (Distance traveled is the “driving factor” in this analysis not in the sense of driving the lorry, but in the sense that variation in weekly distance traveled “drives” variation in weekly fuel use):

Figure 2: relationship between weekly fuel consumption and distance driven

What we see is that there is an element of consumption (about 40 litres per week in this case) that is unrelated to distance driven. Most likely, this is fuel consumed while stationary. The straight-line relationship gives us a more precise gauge of performance because it allows us to deduce expected consumption each week quite accurately. We can thus show the deviation from expected fuel consumption as a time-history chart (Figure 3):

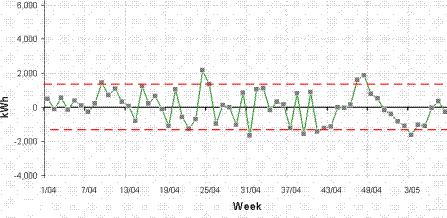
Figure 3: weekly deviation from expected fuel consumption

From this it is clear that there was a change in behaviour on or about 7 October, which manifests itself as a fairly consistent 50-litre-per week excess almost every week since (see the highlighted points).

Furthermore, we can compare the adverse and achievable behaviour on the scatter diagram (Figure 4) in which the post-change points are marked:

Figure 4: comparison of behaviour before and after the change

The red straight line is a best fit through all the post-change points, and it shows us that the apparent excess fuel consumption is not distance-related. It might be a permanent change in terrain or traffic conditions or a new pattern of deliveries with more waiting time…  Or it might be a new driver who doesn’t turn their engine off while waiting. It probably isn’t a mechanical fault, because that would tend to change the gradient of the line. But at least we know when the change occurred (which will help trace the cause), its nature (which helps eliminate some kinds of fault) and its magnitude (which helps us decide whether to bother pursuing the case).

Try getting those insights from tracking the MPG.

This method of monitoring energy performance also applies to buildings and industrial processes, and you can find training on the method at http://vesma.com/training

Tracking performance of light vehicles

Here is a monitoring challenge: suppose you want to do a weekly check on the performance of a small fleet of hotel minibuses. Although you can record the mileage at the end of each week, you will have a lot of error in your fuel measurement because you’ll only know how much fuel was purchased but not when. How can you adjust for the inconsistent fuel tank level at the end of the week?

One method would be to use the trip computer display which will show the estimated remaining miles (see picture). The vehicle in question has a 45-litre tank: at its typical achieved average mpg, it has a range of 613 miles of which it has used 39%, so we can add 45 x 0.39 = 18 litres to our calculated fuel consumption. Note that we will need to deduct an equal amount from next week’s consumption, and this “carry forward” is likely to reduce the error in the adjustment.

This procedure also helps if drivers do not consistently fill to the top. To the extent that they underfill on the last occasion in the week, the shortfall will increase the adjustment volume to compensate. The adjustment can only ever be approximate, however, so it’s better if they consistently brim the tank.

The other advice I would give is to track not miles per gallon (or any similar performance ratio) but to plot a regression line of fuel versus distance. This will pick up, and detect changes in, idling behaviour.

Monitoring electrically heated and cooled buildings

WHEN you use metered fuel  to heat a building (or indeed if you use the building’s electricity supply, but have no air-conditioning) it is straightforward to monitor heating performance critically because you can relate energy consumption to the weather expressed as degree days.

Things get difficult if you use electricity for both heating and cooling and everything shares a meter, as would be the case if you use reversible heat pumps (air-source or otherwise). Because the seasonal variations in demand for heating and cooling complement each other (one being high when the other is low), you may encounter cases where the sum of the two appears almost constant every week. Such was the case on this 800-m2 office building:

Figure 1: apparent low sensitivity to weather


Without going into detail, this relationship implied a heating capacity of little over 1 kW, which is obvious nonsense as there was no other source of heat. The picture had to be caused by overlapping and complementary seasonal demands for heating and cooling, which is illustrated conceptually in Figure 2:

Figure 2: total consumption is the sum of heating and cooling demands


The challenge was how to discover the gradients of the hidden heating and cooling lines. The answer in this case lay in the fact that we had sufficient information to estimate the building’s heat rate, which is the net heat flow from the building in watts per unit inside-outside temperature difference (W/K). The heat rate depends on the thermal conductivity of the building envelope and the rate at which outside air enters. There is a formula for the heat rate Q:

Q = Σ(UA) + NV/3

Where U and A are the U-values and superficial areas of each building element (roof, wall, window, etc), V is the volume of the building and N is the number of air changes per hour. Figure 3 shows the spreadsheet in which Q was calculated for the building in question (an on-line tool to do this job is available at vesma.com):

Figure 3: calculation of heat rate

In this case the building measurements were taken from drawings, the U-values were found on the building’s Energy Performance Certificate (EPC), and the figure of 0.5 air changes per hour is just a guess.

The resulting heat rate of 955.5 W/K equates to 955.5 x 24 / 1000  = 22.9 kWh per degree day. This is heat loss from the building but it uses a heat pump and will therefore require less input electricity by a factor of, in this case, 3.77 (that being the coefficient of performance cited on its EPC).  So the input energy required for heating this building is 22.9 / 3.77 = 6.1 kWh per degree day. This is the gradient of the unknown heating characteristic, the upper dotted line in Figure 2.

Need training in energy management? Have a look at vesma.com

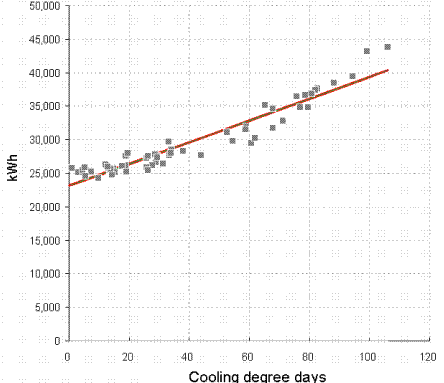
To work out the sensitivity to cooling demand we use a little trick. We take the actual consumption history and deduct an allowance for heating load which, in each week, will be 6.1 times the number of heating degree days (remember we just worked out the building needed 6.1 kWh per degree day for heating). This non-heating electricity demand can now be analysed against cooling degree days and this was the result in this case:

Figure 4: variation of non-heating electricity with cooling degree days


The gradient of this line is 3.5 kWh per (cooling) degree day. It is of similar order to the 6.1 kWh per degree day for heating, which is to be expected; the building’s heat loss and gain rates per degree difference are likely to be similar. As importantly, we now have an intercept on the vertical axis (a shade over 1,200 kWh per week) which represents the non-weather-related demand. Taking Figure 1 at face value we would have erroneously put the fixed consumption at around 1,500 kWh per week.

Also significant is the fact that Figure 4 was plotted against cooling degree days to a base of only 5°C. That was the only way to get a rational straight line and it means there is a finite amount of cooling going on at outside temperatures down to that value. I had been assured that cooling was only enabled “when the weather got hot”. But plotting demand against cooling degree days to, say, 15.5°C (a common default for summer-only use) gave the result shown in Figure 5:

Figure 5: non-heating electricity demand against cooling degree days to a base of 15.5C


This is not as good a correlation as Figure 4 and my conclusion in this case was that when the outside temperature is between 5 and 12°C, this building is likely to have some rooms heating and some cooling.

Carbon emissions – a case of rubbish data and wrong assumptions

The UK Government provides tables for greenhouse gas emissions including generic figures for road vehicles. For example a rigid diesel goods vehicle of 7.5 to 17 tonnes has an indicative figure of 0.601 kg CO2e per km. You need to apply such generic figures with caution, though. I saw a report from a local council that used that particular number to back-calculate emissions from its refuse collection trucks. Leaving aside the fact that many of their vehicles are 26 tonners, they spend much of their time accelerating, braking to a halt, idling and running hydraulic accessories, with the result that one would expect them to do no better than about 4 mpg with emissions more like 1.8 kg CO2e per km, three times the council’s assumed value.

For the council in question that is not a trivial error. Even on their optimistic analysis domestic waste collection represents 33% of their total emissions. Properly calculated (ideally from actual fuel purchases) they will turn out to be more than all their other emissions taken together.

Further reading

Training

For sustainability professionals to make a real practical difference to carbon emissions they need a broad appreciation of technical energy-saving opportunities. To help them understand the potential more clearly I run a one-day course called ‘Energy Efficiency A to Z‘. Details of this can be found at http://vesma.com/training


Network operator promoting voltage reduction

Regular readers of my newsletter will know that I take a pretty dim view of people who try to sell voltage reduction — or what they often misleadingly call “optimisation” –as an energy-saving technique (see footnote for more details)

One of my readers was therefore surprised to read an Observer article on the Guardian web site in which a network operator, Electricity North West (ENWL), was touting the benefits of voltage reduction as a way to cut customers’ bills. The article correctly stated that customers’ kettles would take longer to boil because of reduced power output, but suggested wrongly that their consumption would go down as a result. In fact, it will slightly increase because the longer heat-up time increases the duration of heat loss from the kettle, and that extra heat loss needs to be made up from extra electrical energy input (the amount of heat put into the water is the same, so no effect on consumption there). This same perverse result – higher consumption at lower voltage – will apply to all thermal appliances operated on intermittent cycles.

I looked at some research that ENWL had commissioned on parts of their network, which had shown that a 1% drop in substation voltage had resulted in a 1.3% drop in power to connected customers. That is plausible but not the whole story. It’s true that for some unregulated appliances like incandescent lamps and toilet extract fans, reduced power will have resulted in reduced output (which nobody noticed) and hence lower energy consumption. But for thermostatically-controlled appliances like space heaters, ovens and immersion heaters, lower power will be compensated for by increased run times and there will be no saving. ENWL’s public-relations people have confused power (kW) with energy (kWh).

In reality ENWL probably have a different agenda and I think that the research behind their conclusions is part of a lobbying effort to get the legal limits on voltage relaxed, which will make it life easier for them in a world of distributed generation. When customers’ solar panels are generating at their peak, they tend to push the voltage up on the low-voltage network; and conversely being able to drop the voltage maximises how much solar power can be absorbed. Pretending that lowered voltage saves money is part of their pitch.

Footnote: 

Different types of electrical equipment will respond in different ways to reduced supply voltages. In short:

1. If the equipment is regulated in any manner, either in terms of its output or internally to maintain set voltages for electronics, don’t expect voltage reduction to save energy.

2. If it is unregulated and you don’t mind reduced output, voltage reduction will save energy.

3. If it is a thermal application used on an intermittent cycle, voltage reduction will have a perverse effect, increasing energy consumption.

Gross and net calorific value

“Efficiency” in our business means the ratio of the useful output energy to total input energy. Unfortunately, when evaluating combustion performance, there are two versions of the input energy because any hydrocarbon fuel has both “gross” and “net” calorific values (GCV and NCV).

To understand the difference, you have to appreciate that the products of combustion include water vapour, and that it takes energy (latent heat) to vaporise water whether it happens in a kettle or as part of the combustion process. In a condensing boiler you get that latent heat back. A fuel’s GCV counts all its chemical energy but its NCV disregards that fraction (10% in the case of natural gas) that will be absorbed as latent heat. So when you calculate efficiency on the basis of NCV you get a higher value than if you had used GCV, to the extent that you see condensing boilers advertised as having over 100% efficiency. That is actually true on an NCV basis, but only because there’s energy in the fuel that NCV ignores.

Why does this matter? Because when you look at a combustion test report from a maintenance contractor it may well be on an NCV basis, which somewhat flatters the performance. I prefer to use the GCV basis. Some combustion analysers also make an allowance for boiler standing losses in an effort to give a supposedly more realistic overall efficiency figure, but that just clouds the issue in my mind.

If you want to be sure you are getting results (a) in GCV terms and (b) without deductions for standing losses, you can take the raw measurements from a boiler test and feed them into this on-line calculator, which incidentally lets you try changing the input assumptions for a side-by-side estimate of the savings that would result.

ISO50001 Q&A

One of my newsletter readers, A.M., wrote from New Zealand with a series of questions about ISO50001, the management-systems standard for energy management. He has just started to get to grips with the 2018 edition. Here are his questions and my answers:

A.M.: How we distinguish between boundaries and scope? if boundary is simply the physical borders for the system (e.g. the office buildings), what is scope then? and if scope is for example “transportation” and etc., why in SEU [significant energy use] we say “Transportation” could be an SEU as a process?

V.V.: “Scope” means the range of activities covered. For example “manufacturing processes” or “heating, ventilation and air conditioning” or, as you say “transportation”. Within transportation you might have, for example, “freight” as an SEU, but equally you could declare all transport as significant. There is no paradox here.

A.M.: In the new edition, the top management shall take all the responsibilities that the representative had in the last edition. This sounds impossible to delegate all the tasks to the top management. How do we cope with this?

V.V.: If you are responsible for a task you can delegate it but still keep responsibility, i.e., it is your fault if the people you delegated it to fail to carry it out properly. Managers are accountable for the actions of subordinates.

A.M.: In section 4.3, page 8, after b) we have a statement “The organization shall not exclude an energy type within the scope and boundaries” I do not understand the idea! why we are not allowed to do so?

V.V.: The requirement seems logical to me. For one example: if you have transport as your scope and you have plug-in hybrid vehicles, it is reasonable to insist that you cannot exclude any electricity used by them. Another example: if you had an oil-fired boiler and replaced it with a wood-fired one, it would evidently be wrong to exclude the wood fuel from consideration.

A.M.: If a new opportunity would become replacing diesel boiler with wood pellet, it means we are changing the energy types which does not necessarily reduce the energy costs. Can we call it action plans?

V.V.: ISO50001 is about managing energy performance, not costs or carbon. If substituting a different fuel improves the energy performance, it will contribute to your aims and objectives, so it would make sense to classify the work as an action plan.

A.M.: I understand that for each energy type, we identify SEU(s) and for each SEU, we list the action plans. What if one action plan reduces diesel and increases electricity? Do we still keep it as an action plan for diesel?

V.V.: What matters is the overall energy performance. If the amount of electricity consumption that you add exceeds the amount of diesel energy saved, your energy performance would be worse after the project and it would therefore make no sense to include the project in an action plan within your EnMS. If the project is going to improve energy performance, you could declare it as part of an action plan.

Chiller fan and motor replacement

By Lawrence Leask, Excalibur Energy

Recent changes to legislation means that operators of HVAC chillers and refrigeration equipment should review their equipment and the availability of replacement condenser fans.

In the past few months, we have had several enquiries to supply replacement AC axial fans for air cooled chillers from end users unable to obtain direct replacement fans, or where the cost has become prohibitive. Their predicament is not unusual and the situation is likely to get worse, with many fans no longer being manufactured, or only manufactured in short production runs.

Since 2017, all new condenser fan motors used on new chillers and condensers are required to meet the International Electrotechnical Commission (IEC) motor efficiency regulations and the Energy-related Products Directive 2015 (ErP). This has pushed manufacturers to look at the overall efficiency of fans and account for the entire fan, including the control electronics, motor, bell mouth and impeller and to define minimum efficiency requirements for the fans.

New Equipment manufacturers cannot use products that do not meet the regulations on new equipment but can continue to sell motors or fans that do not meet the regulations as spares to existing equipment.

Fan manufacturers and OEM’s have benefited from the spares market at the expense of the end user by selling replacement parts at ridiculously high margins. In addition to these high costs imposed on the end user, the end user should avoid trying to repair motors, as rewinds further reduce efficiency.

EC motor technology is around 30% more efficient than AC motors due to the secondary magnetic field coming from permanent magnets rather than copper windings

For many clients, we have removed all the existing AC fans and replaced them with the latest design IE4 Super Premium EC fans which have built in speed controls making them perfect for HVAC applications.

With speed control built into each motor, it allows all the fans on each circuit to operate together, modulating the speed to maintain accurate discharge pressure dependent on the cooling demand and ambient air temperature.

When you consider the CIBSE guidelines HVAC equipment life cycle is 15-25 years and that AC fans typically last 5-8 years it makes the retrofitting of EC fans a viable option to re-life an asset whilst improving efficiency and making use of the latest technology without the disruption and total cost of replacement.

Postscript: condenser cleaning
That’s the way to do it

Dirty condensers can also have a drastic effect on compressor efficiency. To clean an air-cooled condenser correctly the fans should be removed and the coils cleaned in the opposite direction to airflow. This is rarely done due to cost and disruption, but incorrect cleaning in the direction of airflow can bury debris deeper into the coil, further reducing airflow and efficiency.

The correct deep cleaning of condenser coils can economically be undertaken at the same time as fan replacement as access can be gained during fan removal.

–o–

Excalibur Energy is willing to provide fully costed proposals with an energy analysis showing how performance can be improved for refrigeration energy-saving projects in connection with ESOS assessments which includes air-cooled chillers and condensers, dry air coolers and evaporative condensers. Contact: 

Unit 115 Rivermead Business Park, Swindon SN5 7EX. 

Tel: 01793 934058 or email

LED versus metal halide lamps

Clare C., a regular reader of my energy-management bulletins, was perplexed when she started researching the cost advantages of LEDs as replacement for metal halide (MH) high-bay fittings. She discovered that MH lamps have luminous efficacies very similar to LEDs with both, broadly speaking, yielding about 100 lumens per watt. Certainly she wasn’t going to get the 50% saving she was after, and she asked my opinion.

There are a couple of factors that would tip the balance in favour of LEDs. Firstly, she needed to account for the fact that unlike LEDs, MH lamps need control gear which would add some parasitic load (say 20 watts on a 400-watt lamp).  Secondly, LEDs are more directional and can deliver all their output more effectively to the working space; MH lamps are omnidirectional and need reflectors which may lose some of the light output. So in terms of useful light output per circuit watt, a well-specified and correctly-installed LED fitting may have a moderate advantage.

But the big gain is in controllability. MH lamps have a warm-up time measured in minutes and a ‘restrike’ time (after turning off) which is longer still, to allow them to cool before being turned on again.  This is common to all high-intensity discharge (HID) lamps. It does not matter how long the delay is; it discourages the use of automatic control so  HID lamps are often turned on well before they are needed, and then stay on for the duration. LEDs by contrast can be turned off at will and as soon as they are needed again, they come on. This is where Clare will might get her 50% saving.

High-intensity discharge lamps in a sports hall – a good candidate for LEDs because of erratic occupancy

Phase-change thermal storage materials

Ice storage is sometimes used in central air conditioning systems as a way of smoothing demand for chilling, thereby reducing the installed chiller capacity or allowing demand to be time-shifted. It’s attractive because the latent heat absorbed or released as the water changes phase between liquid and solid is an order of magnitude more than can be stored and recovered just by heating or cooling liquid water.

With phase-change storage established as a legitimate and effective element of central air conditioning and heating plant, it should come as no surprise that we now see vendors offering phase-change materials (PCM) to be embedded in the fabric of buildings as a way of stabilising internal temperatures and thus (according to their claims) saving energy. Are such claims likely to have any merit?

The concept of a PCM such as ice is that as any substance melts (or solidifies), it absorbs (or releases) heat without a change in temperature. PCMs for use in building elements such as walls or ceilings are usually either salts or waxes that change phase at the building’s internal set-point temperature. The argument goes that when daily outside-air temperatures swing above and below the internal set-point, heat stored during the hot part of the day is released during the cold part, avoiding the need for artificial cooling or heating. However, such circumstances are rare. What would happen in a more realistic scenario where, say, the weather is cold and the space needs heating? Firstly, if the space needs heating continuously, the PCM will never change phase and will thus be redundant. It will either be permanently solid or permanently liquid, depending on which side of its melting point the space is being held.

Now suppose the space is heated intermittently. If the internal set-point were below the PCM’s melting point, it would never melt, so it would have no effect. But if the heating set-point were above the PCM’s melting point then it would absorb heat during the warm-up part of the heating cycle. The problem with this is that it would retard the rise in space temperature and delay the achievement of set-point. This would call for a longer pre-heat period — which  incurs an energy penalty. At the end of occupation the heating would go off and any heat stored in the PCM would dissipate to no effect back into the unoccupied space, keeping it at an artifically elevated temperature and losing heat to outside at an unnecessarily-high rate until the PCM had resolidified.

Similar considerations apply to cooling. If the PCM is effective it will retard the effect of the room air-conditioning system. This could result in complaints, for example in settings such as hotels where this technology is being actively promoted.

The ‘demonstration’ rig used by one vendor in an online video. In each of two sealed cells a lamp heats the floor, which has insulation beneath it. The right-hand cell has PCM immediately beneath the floor. Temperatures were measured at the top of the insulation, so the right-hand cell indicates the temperature of the PCM, which naturally levels off at its melting point. What neither thermometer showed was the important thing: the temperature inside the cell.

Skeptical of the online video purporting to demonstrate the effect (see diagram), I set up a simple mathematical simulation of the warm-up cycle of a heated room with PCM embedded behind plasterboard in its outer wall. The outcome was even worse than the description I gave earlier. At 5C outside the PCM did not start to store heat until the room temperature went nearly two degrees above the PCM melting point This is because the intervening plasterboard acts as a thermal insulator, keeping the PCM below the room temperature even though it I had 100mm of insulation on its cold side.

On a positive note, PCM layers may have a role to play in moderating overheating from solar gain to roofs in particular, for example in attic rooms. I have measured external roof-tile surface temperatures of 50C in the UK, which even with insulation behind it results in uncomfortable internal temperatures on the sloping ceiling behind it. 25mm of PCM under the roofing felt would absorb, by my calculations, the first 2.5 kWh per square metre of solar gain. Keeping the internal surface cooler would help alleviate discomfort and with internal insulation the stored heat would dissipate preferentially to the night sky.


For training on energy management topics see http://vesma.com/training